


Most businesses spend $1,500–$10,000/month on Facebook ads to get meaningful data, and $5,000–$30,000+ when they’re serious about scaling. At the platform level, you’ll typically see $8–$25 CPM and $0.60–$2.50 CPC, but the actual cost that people often overlook is the full stack: ad spend, creative production, tracking/setup, and ongoing management.
When people ask me how much Facebook advertising really costs, I always start by reframing the question, because the answer goes far beyond ad spend alone.
I’ve managed Facebook ad campaigns across multiple industries, and what I’ve consistently seen is that two businesses can spend the same amount with wildly different outcomes. The gap usually comes down to how well they understand the full Facebook ad cost stack, like how creative, tracking, and management decisions influence performance.
Meta’s own advertiser documentation emphasizes relevance, engagement, and learning stability over raw budget size.
In this guide, I’m going to break down Facebook advertising costs in a way that I’ve learned to evaluate them: honestly, practically, and without the quick fixes that usually lead to wasted spend.
Don’t want to handle this alone? Our Meta Ads Management Services can help.
Below is a quick breakdown of estimated Facebook ad costs by industry:
Here are the estimated Facebook advertising costs by country:
The Real Facebook Ad Cost Stack (More Than Just “Ad Spend”)
When I break down Facebook advertising costs for clients, I always start with one correction: ad spend is only one piece of the total cost.
Facebook ads behave less like a simple media buy and more like a system where creative quality, tracking accuracy, and management decisions directly affect what you pay.
Here’s what Facebook ads cost today:
Media Spend (What You Pay Meta Directly)
This is the most visible cost: the money you pay directly to Meta to enter the auction.
In benchmark reports for 2025–2026, average Facebook ad CPMs tend to fall broadly within the $8–$25 range, although they vary significantly by industry, audience, and competition.
What matters more than the number, though, is why it moves. Meta’s auction rewards ads that generate engagement and expected actions, not just higher bids.
Across various campaigns, I’ve consistently seen higher-quality ads win auctions at lower effective costs, even in crowded markets.
Creative Cost (The Part Most Brands Underfund)
If there’s one area brands consistently underinvest in, it’s creative. In my experience, creative quality has more influence on CPM and CPA than targeting tweaks ever will.
However, creative costs change dramatically depending on the format you choose.
- Static image ads (basic design, light copy): $100–$500 per asset
- UGC-style videos (creator-led, short-form): $300–$1,500 per video
- Professional video production (scripted, edited, branded): $2,000–$10,000+
- Ongoing creative refresh retainers: $1,000–$5,000 per month
The format directly impacts your upfront cost and your performance ceiling.
Video often commands higher CPMs because it consumes more attention, but strong video creative typically drives better engagement rates and lower CPAs over time. Static images cost less to produce, but they fatigue faster in competitive markets.
Meta has emphasized repeatedly that ad quality and user experience influence auction outcomes. That means format choice directly impacts performance signals.
Accounts that rotate high-performing creative formats every 2–4 weeks maintain more stable CPMs than those relying on a few static ads for months.
So, yeah, strong creativity earns attention (Always, lol).
Also read: Proven Ways to Effectively Manage Your Facebook Page
Tracking + Measurement Cost (The Hidden Line Item)
Tracking quietly decides whether Facebook ads get cheaper or more expensive over time. Generally, the accounts that struggle with high CPAs usually don’t have a “bad audience” problem but a weak signal problem.
Here’s what tracking usually costs (setup + ongoing):
A basic Meta Pixel implementation, including standard events and domain verification, depends on who you hire and how complex your website is. On platforms like Upwork, freelancers charge between $20 and $49 per hour. For a straightforward site, the setup often takes only a few hours.
Conversions API (CAPI) setup varies more. Meta provides multiple implementation paths. Some partner integrations cost $0 to implement, while server-based setups can involve cloud-related fees starting around $30 per month, depending on your provider and traffic volume.
Management Cost (What You Pay for Brains and Time)
When I look at Facebook advertising costs, I separate media spend from management because they behave differently.
Facebook ad management typically falls into one of these pricing models:
- Freelancer management: Often ranges from $500–$2,000 per month, depending on account complexity.
- Small agency retainers: Commonly $1,500–$5,000+ per month.
- Percentage of ad spend: Typically 10–20% of the monthly media budget.
- Performance-based models: Less common, usually layered on top of a base fee.
Bottom line:
Facebook ad costs are the result of media, creative, tracking, and management working together. Ignore any one layer, and the others get more expensive to compensate.
Ready to scale? Check out our Social Media Management Services.
Facebook Ad Pricing Basics (The Metrics That Control Your Bill)
Businesses usually overspend on Facebook because they misunderstand the metrics that shape their bill. Facebook ad costs are not random. They’re the outcome of a few core performance signals interacting inside the auction.
If you understand those signals, you can forecast spend and protect profitability. If you don’t, costs drift upward without warning.
The following four metrics determine what you ultimately pay:
CPM (Cost per 1,000 Impressions)
CPM is the price you pay to show your ad to 1,000 people, and it’s the foundation of every Facebook ad cost. In recent industry benchmarks, average Facebook CPMs range between $5 and $25 (As I already said), with competitive sectors like finance, SaaS, and e-commerce pushing higher during peak periods.
What many people miss is that CPM is a feedback signal. Meta has stated repeatedly that ads with higher expected engagement and relevance are rewarded with lower CPMs.
Marketers like Jon Loomer have echoed this for years: better creative and clearer intent reduce auction pressure more reliably than bid manipulation.
CPM spikes usually point to creative fatigue, weak offers, or poor audience alignment, not bad luck.
CPC (Cost per Click)
CPC tells you how much you’re paying for attention. Across industries, Facebook CPCs typically land between $0.50 and $3.00, but that number is meaningless without context.
Moreover, clicks don’t equal intent. Meta’s delivery system increasingly optimizes toward downstream behavior, meaning low-quality clicks can increase costs later by poisoning the learning phase.
As Andrew Foxwell (former Facebook PM, now independent consultant) often points out, optimizing for cheap clicks without downstream conversion data trains the algorithm in the wrong direction.
CPA / CAC (Cost per Acquisition / Customer Acquisition Cost)
CPA is where cost becomes real. It reflects what you pay to generate a lead, sale, or signup. CPA is less about Facebook and more about everything around Facebook: offer clarity, landing page conversion rate, and post-click experience.
Currently, even a 1% increase in conversion rate (e.g., from 2% to 3%) can raise leads or revenue by 30–50% for the same ad spend.
That matches what I see in practice: advertisers obsess over audiences when they should be fixing pages and offers.
CPA exposes weak fundamentals faster than any other metric.
ROAS And Why It Can Lie
Let me keep it short but to the point: a campaign can show strong short-term ROAS while quietly damaging long-term growth. This happens most often in retargeting-heavy accounts or when attribution windows mask true incrementality.
Even Meta has acknowledged attribution limitations post-iOS updates. Analysts like Rand Fishkin have been vocal about the danger of over-crediting last-click platforms. From what I’ve observed, ROAS works best as a directional indicator, not a decision-maker in isolation.
Good advertisers use ROAS alongside CPA, volume, and business margin - not instead of them.
The Auction Explained Like a Business Owner
Most people think Facebook ads work like a bidding war where the highest spender wins (I wish it were like that). The assumption is expensive, and it’s never been true.
Facebook advertising runs on an auction, but not a price-only auction. Meta has explained this consistently in its advertiser documentation: ad placements are awarded based on total value, not budget size alone.
In practical terms, Facebook evaluates every ad impression using three inputs:
- Your bid (what you’re willing to pay)
- Estimated action rate (how likely a user is to click or convert)
- Ad quality (engagement, relevance, and negative feedback signals)
Meta has stated that ads with higher predicted engagement and better user experience are more likely to win auctions at a lower effective cost.
According to Meta’s own performance guidance, relevance signals can outweigh bid size when competition is high.
Smaller advertisers with disciplined creative testing often outperform larger brands that rely on brute-force spend. Improving ad quality is one of the few levers that consistently lowers CPM without sacrificing scale.
The way I explain it to business owners is simple: you’re not buying attention outright; you’re earning it through signals.
The stronger those signals, the less you pay to compete. When you understand that, Facebook ad costs stop feeling random and start feeling manageable.
Related article: Facebook Ads for Local Businesses
Cost Drivers That Move CPM, CPC, and CPA the Most
Cost drivers do not operate independently. When one shifts, the others respond. If CPM increases and CTR stays flat, CPC rises. If CPC rises and the conversion rate stays unchanged, CPA increases automatically (Not that easy, to be honest).
Most advertisers look at one metric at a time. Cost control requires understanding how they interact.
Below are the variables that move advertising costs the most and how they influence one another.
Industry Pressure
Some industries face structural auction pressure. Finance, insurance, legal services, and SaaS typically compete more aggressively for high-value customers. That competition raises baseline CPM.
When industry pressure pushes CPM higher, your only practical defenses are a stronger click-through rate or an improved conversion rate. If neither improves, the acquisition cost rises proportionally. Industry competition sets the floor. Execution determines whether you rise above it.
Audience Size and Intent Level
Audience targeting affects cost more than many advertisers realize. Broad audiences allow the algorithm to distribute delivery efficiently. On the other hand, extremely narrow audiences restrict inventory and increase volatility.
In simple words, intent level changes the economics. Cold audiences often produce lower CPM but weaker conversion rates. Retargeting audiences usually cost more per impression but convert at a higher rate. If retargeting audiences become too small, however, CPM increases while volume declines.
When evaluating overall social media management pricing for paid campaigns, audience fragmentation is often a hidden cost driver. Over-segmentation inflates delivery costs without improving outcomes.
Geography and Purchasing Power
Geography affects auction pressure directly. Tier-one markets such as the United States, the United Kingdom, Canada, and Australia attract higher advertiser density. That increases CPM.
Lower-cost markets may deliver cheaper impressions but often show weaker purchasing intent. Cost per impression and cost per customer are not the same. Many advertisers comparing Facebook to Instagram advertising cost overlook how geography and buyer strength shape performance.
Placement and Format Choice
Okay, things get even more interesting. Restricting placements limits available inventory and increases clearing price pressure. Allowing broader placements expands inventory and often stabilizes CPM.
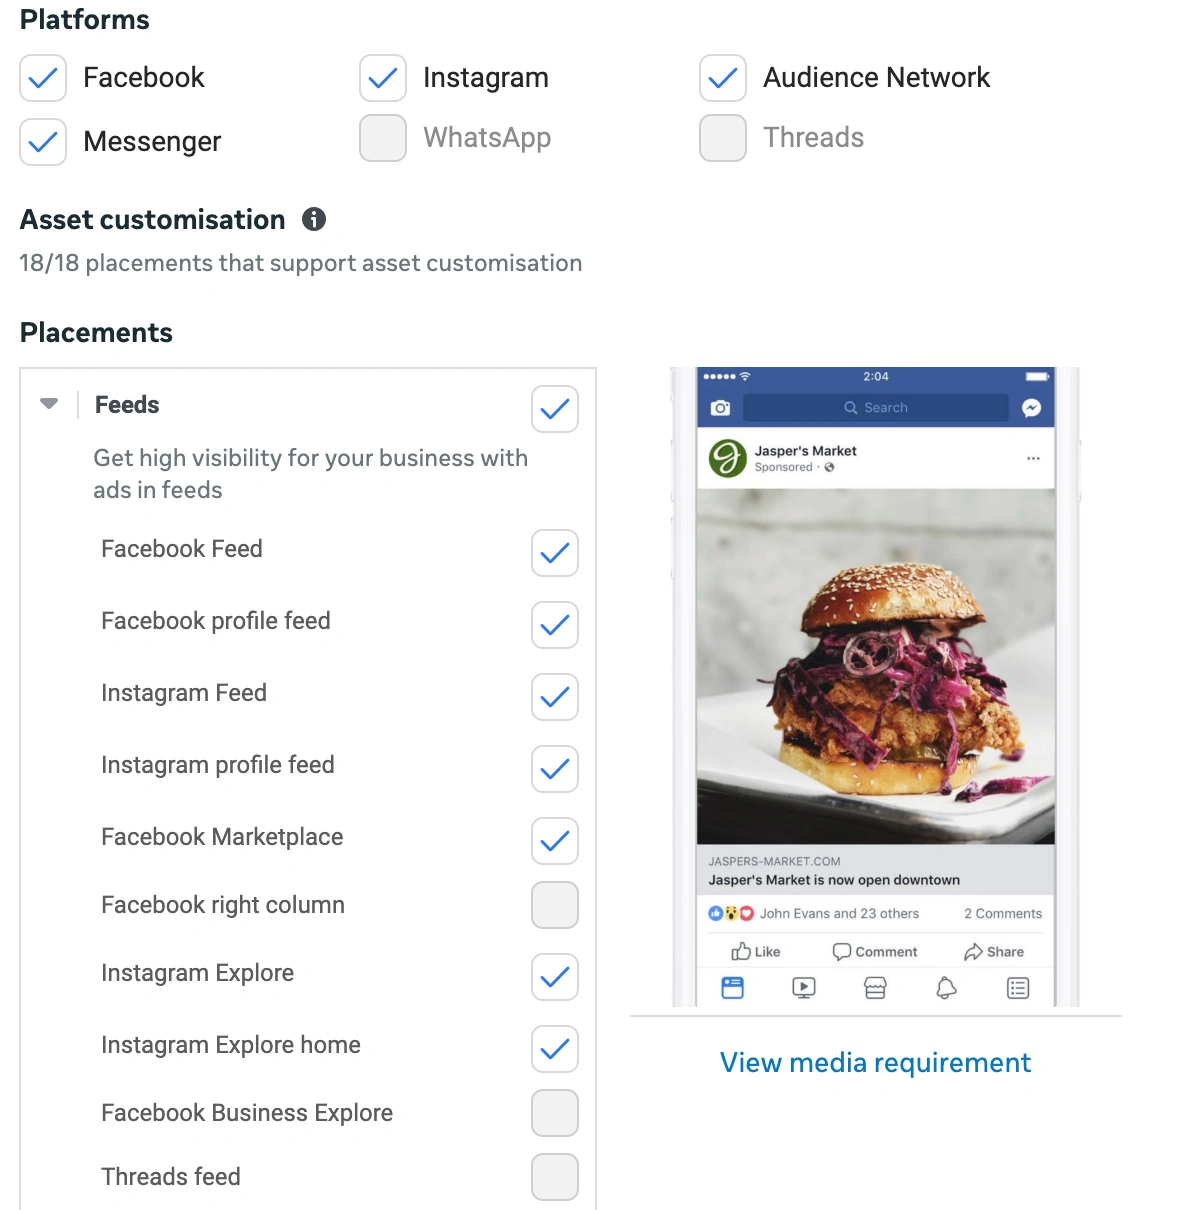
Format influences engagement behavior. In most cases, video content often generates stronger interaction signals. Static images tend to fatigue faster in competitive environments.
Carousel ads can improve click-through rate when multiple benefits require explanation.
Format decisions also affect production investment. Brands assessing overall video creation cost should account for how format impacts engagement signals and, indirectly, cost efficiency.
If engagement improves meaningfully, CPC can stabilize even when CPM rises.
Also read: Digital MarketingAgency Pricing
Offer Strength (The Biggest Factor People Ignore)
Honestly, offering strength drives conversion rate more than targeting refinements do.
If the conversion rate drops from three percent to one and a half percent, the acquisition cost doubles, even if CPM and CPC remain stable.
Don’t make it too complicated, please: clear value, urgency, and differentiation influence both click behavior and post-click performance. Weak offers force Meta to search harder for responsive users, which increases cost.
Landing Page Conversion Rate
Landing page efficiency is another multiplier. When CPM and CPC remain stable but the conversion rate declines, CPA increases immediately (It makes sense, IMO).
Paid traffic magnifies page friction. Slow load speed, unclear messaging, or misaligned expectations increase cost faster than targeting adjustments correct them.
Improving conversion rate produces a more predictable reduction in CPA than most bid or audience tweaks.
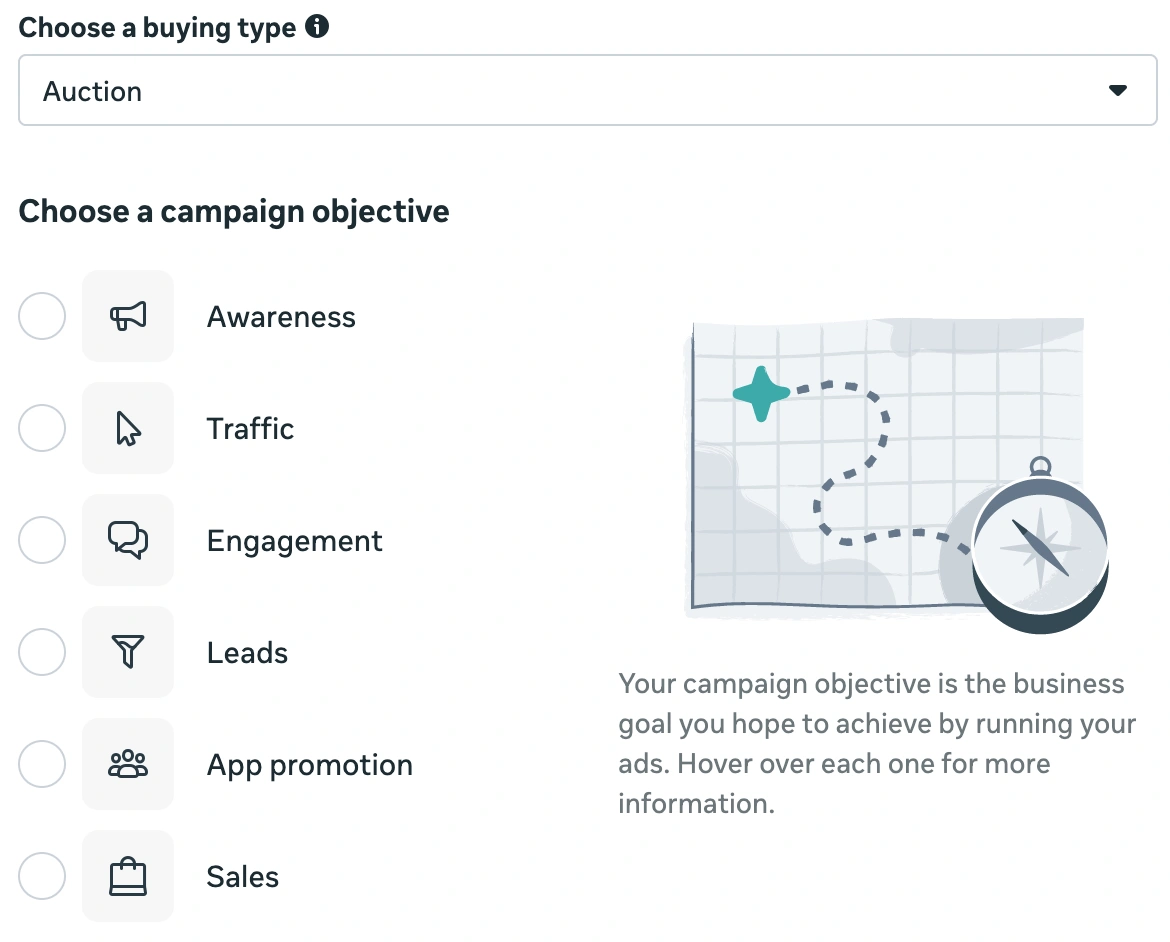
Facebook Ad Campaign Types and Their Cost Profiles
Different campaign types produce different bills (But they also produce different results).
So, awareness usually buys reach efficiently. Conversion usually buys intent expensively. Lead gen can look cheap until lead quality shows up in sales data.
The pattern holds because Meta’s auction optimizes toward the objective you choose, and Meta has said the “right objective” is one of the core components that affects how ads perform in the auction.
Below is how I think about each objective when someone asks me to forecast costs and set expectations.
Awareness Campaigns
Awareness is usually the lowest-friction way to buy attention, but it rarely produces the lowest cost per customer.
Awareness optimizes for reach/impressions, so the platform can prioritize cheaper inventory. The trade-off is simple: you may get efficient CPMs, but you still need a second step (retargeting or conversion campaigns) to turn that attention into revenue.
A practical benchmark mindset: use awareness when you need distribution (new product, new market, new offer), and you can measure lift with downstream actions later, not immediate purchases.
Traffic Campaigns
Traffic often produces the “nicest looking” CPC and the most misleading outcomes.
Traffic campaigns optimize for clicks and landing page views. That can reduce CPC, but click-optimization can attract low-intent users if the conversion signal stays weak. This is why many teams report “tons of traffic” with weak sales.
If you run traffic, I treat it as a diagnostic tool. It helps validate creative hooks and landing page messaging before you pay conversion prices. It also helps when you’re balancing broader social media marketing costs and need top-funnel volume with clear guardrails.
Lead Generation Campaigns
Lead gen can be cost-efficient per lead, but quality varies more than most teams expect.
Lead ads reduce friction (native forms), which often lowers CPL compared to sending people to a landing page, particularly on mobile.
Benchmark reporting from WordStream notes Lead Ads CPC sitting around $1.92 (overall), and that Lead Ads saw a smaller year-over-year CPC increase versus Google Ads in their dataset.
The hidden cost is operational if your follow-up process is slow, even “cheap” leads turn expensive. For B2B, I also factor sales cycle length and lead validation steps before calling a CPL “good.”
Related article: Facebook for B2B: The Complete Guide
Sales / Conversion Campaigns
Conversion campaigns usually cost more per click and per thousand impressions, but they produce the cleanest optimization when tracking is solid.
Conversion objectives rely heavily on feedback signals (purchase, lead, subscribe). When those signals are accurate, Meta can optimize delivery toward higher-intent users.
Meta’s auction documentation explains that delivery considers your bid, estimated action rates, and ad quality. While conversion campaigns lean hard on that “action rate” component.
Retargeting Campaigns
Retargeting often produces the best short-term efficiency, but it hits a ceiling fast.
Retargeting audiences carry higher intent, so conversion rates tend to look stronger. The cost risk comes from audience size and saturation: small pools can push frequency up, inflate CPM, and reduce incremental returns.
Retargeting also tends to “claim” revenue that would have happened anyway, so I’m careful with attribution and use holdout logic where possible.
If your team runs multiple channels, also compare retargeting performance against Instagram advertising cost behavior, since placement mix and audience overlap can change delivery economics even inside the same Meta account.
Related article: How to Measure Facebook Advertising ROI
Test Budget vs Scale Budget: What to Invest
Before increasing ad spend, I always separate the test budget from the scale budget.
They serve different purposes and require different expectations.
A test budget exists to validate creative, audience structure, offer strength, and tracking accuracy. A scale budget exists to increase volume after those variables prove stable.
Many advertisers blur this line. They try to scale before validating fundamentals, then blame rising CPM or CPA. In practice, scale amplifies whatever already works or whatever is broken.
A controlled test phase focuses on signal clarity and cost stability. A scale phase focuses on volume expansion without destabilizing acquisition cost. Treating them as the same stage usually inflates the cost per result.
Below is how I structure the difference.
Daily Budget Expectations by Goal
Daily budget expectations depend on your objective. The platform does not require a fixed minimum to run ads, but the algorithm does require enough volume to learn. If you underfund a campaign, you delay signal collection. If you overfund a campaign too early, you amplify inefficiencies.
Here’s how I generally frame daily budget expectations by goal type for small to mid-sized businesses.
Daily Budget Expectations by Objective
These are not fixed rules. They assume average competitive pressure and stable tracking. High-ticket industries or Tier-1 markets require more budget to reach statistical confidence.
For example, if your target CPA is $50 and your conversion rate sits at 2%, you need roughly 50 clicks to expect one conversion. If your CPC averages $1.50, that implies approximately $75 in spend just to produce one acquisition event.
The math illustrates why conversion campaigns struggle when budgets are too low.
The Hidden Costs That Blow Up “Affordable” Facebook Ads
When someone says Facebook ads are “affordable,” I usually ask one question: affordable compared to what?
Most cost discussions focus only on media spend. The invoice from Meta looks clear. The surrounding expenses rarely do. That’s where many businesses underestimate total investment.
These hidden costs don’t appear in Ads Manager, but they directly influence acquisition cost and long-term efficiency.
Agency or Freelancer Management Fees
Management fees vary widely depending on experience, scope, and structure.
Freelancers often charge between $500 and $2,000 per month for ongoing management. Small agencies typically operate between $1,500 and $5,000 per month, while larger agencies may charge 10–20% of ad spend in addition to a base retainer.
Those fees usually include:
- Campaign structure and testing framework
- Budget allocation decisions
- Creative testing coordination
- Reporting and optimization
The cost escalates when accounts require advanced attribution setup, multiple funnels, or aggressive scaling.
Creative Production and Refresh
Creative does not remain effective indefinitely. Fatigue sets in, engagement drops, and CPM often increases when the same ads circulate too long.
In most cases, production costs vary significantly.
Simple static ads can cost $50–$300 per asset, depending on the designer and scope. While short-form video ads typically cost $300–$2,000+, depending on complexity. And UGC-style content is variable and based on creator fees and usage rights.
Ongoing refresh cycles multiply those numbers. A campaign scaling from $100 per day to $1,000 per day requires more creative volume to maintain stability.
Brands that underestimate video creation costs frequently experience rising CPA because creative refresh lags spend growth.
Creative expense is not a one-time investment. It scales with performance ambition.
Landing Page Work (And Why It’s Part of Ad Cost)
Landing pages directly influence CPA. If the conversion rate declines, the acquisition cost rises immediately, regardless of targeting precision.
Landing page optimization often includes:
- Copy revisions
- Speed improvements
- Design adjustments
- A/B testing tools
Hiring a CRO specialist can range from a few hundred dollars for basic audits to several thousand for structured testing programs. Development updates add further cost if the site requires custom work.
Advertisers comparing Facebook performance to channels like Instagram advertising cost or LinkedIn advertising cost sometimes blame platform pricing when the landing page drives inefficiency.
Paid traffic magnifies weaknesses. It does not compensate for them.
Also read: Is Facebook Advertising Still Worth It in 2026?
How to Lower Facebook Ad Costs Without “Tricks”
Lowering Facebook ad costs does not require secret tactics. It requires improving the variables that influence auction performance. When CPM rises, advertisers often look for targeting hacks or bid manipulation. Those rarely produce durable results.
Cost efficiency improves when engagement signals strengthen and conversion rate increases. That means focusing on fundamentals.
Fix Creative First
Creative influences CTR, estimated action rate, and ad quality feedback. When engagement drops, CPM and CPC tend to rise. Meta’s own auction documentation confirms that expected action rate and ad quality directly influence delivery outcomes.
Performance educators like Andrew Foxwell consistently emphasize creative testing as the primary cost lever inside Meta accounts. Adjusting targeting rarely fixes weak creative.
In accounts where costs increase, I review:
- Hook strength in the first three seconds
- Offer clarity
- Format fatigue
- Frequency levels
If CTR declines meaningfully while CPM rises, creative fatigue is usually the first suspect.
Improve Conversion Rate Before You Touch Targeting
If CPM and CPC remain stable but CPA increases, the issue often sits post-click.
Small improvements in landing page conversion rate significantly reduce acquisition cost without increasing traffic volume.
Here’s the math:
If the conversion rate drops from 3% to 2%, the CPA increases by 50%, even if the traffic cost stays identical.
No targeting adjustment offsets that drop efficiently.
Before adjusting audiences, I review the message match between ad and page, page load speed, offer positioning, and checkout friction.
Paid traffic magnifies page weaknesses. It does not compensate for them.
Let Meta Learn, Then Intervene With Discipline
Frequent intervention destabilizes performance.
Meta’s system requires conversion data to optimize effectively. When advertisers prematurely reset campaigns, edit them too aggressively, or unnecessarily duplicate campaigns, the learning process restarts.
Meta’s own guidance advises allowing campaigns to exit the learning phase before making significant structural changes.
When optimizing, discipline matters more than activity. I typically adjust only one major variable at a time: creative, budget, audience, or objective, and observe performance over a meaningful data window before intervening again.
Lowering costs is rarely about doing more. It is about making fewer, smarter changes.
How to Pick the Right Management Model
The right management model depends on your spend level, internal capability, and growth expectations.
If your monthly ad spend is high enough to justify a full-time specialist, in-house management can make sense. Experienced paid media managers often command salaries in the $70,000–$120,000 range annually, depending on market and experience.
The advantage is speed and control. The risk is overhead if spend or testing volume drops.
Freelancers are often a strong fit for accounts spending between a few thousand and mid-five figures per month. Typical retainers range from $500 to $2,000 monthly, depending on scope. This model works well when the campaign structure is not overly complex and creative production sits elsewhere.
Agencies become relevant when you need media buying, creative production, CRO, and analytics working together. Retainers frequently range from $1,500 to $5,000 or operate as 10–20% of ad spend. This model increases total investment but can reduce the internal coordination burden.
When evaluating total costs, management costs often influence profitability more than small CPM fluctuations. The question isn’t which model is cheapest. It’s the model that matches your budget scale and operational complexity.
The Simple Forecast Model (So You Can Plan Spend Like a Pro)
Before increasing the budget, build a simple forecast based on conversion math.
Here’s the structure:
- Define your acceptable CPA.
- Estimate conversion rate.
- Estimate expected CPC.
- Reverse-calculate the required spend.
Example:
If your target CPA is $50 and your landing page converts at 2%, you need roughly 50 clicks to generate one customer.
If your expected CPC is $1.50:
50 clicks × $1.50 = $75 per expected acquisition.
That means your economics are broken unless the conversion rate improves or the CPC drops.
This model works across objectives, whether you’re comparing Facebook to Instagram advertising cost or evaluating higher-intent channels like LinkedIn advertising cost.
Forecasting removes guesswork. It turns campaign planning into math instead of optimism.
When budgets increase, revisit the model. If the conversion rate declines under scale pressure, your projected CPA changes immediately.
Ad costs become manageable when forecast assumptions remain honest.
The Key Takeaways: What Facebook Ads Really Cost
Facebook advertising does not become expensive on its own. Costs rise when creativity weakens, when conversion rate is low, or when campaigns scale without structural discipline. The platform responds to performance signals. When those signals are strong, costs stabilize. When they deteriorate, acquisition becomes unpredictable.
Businesses that manage this well focus less on tracking cheaper clicks and more on strengthening fundamentals: offer clarity, creative consistency, accurate tracking, and structured optimization. When those pieces align, budgeting becomes measurable instead of reactive.
For brands evaluating overall pricing, the goal is not to find the lowest possible spend. It is to build a system that produces a stable acquisition cost at a sustainable margin. When such a system is in place, scale becomes a decision.
Why Did My CPM Suddenly Spike Even Though Nothing Changed?
CPM increases usually come from external competition, seasonal demand shifts, audience fatigue, or engagement decline. Even if your budget stays the same, auction density can rise when more advertisers target the same audience. If your click-through rate drops at the same time, that signals creative fatigue rather than market pressure.
When CPM spikes, review frequency, recent creative performance, and industry seasonality before making structural edits.
Is It Better to Optimize for Purchases, Add-To-Cart, or Initiate Checkout?
Optimize for the deepest conversion event your budget can consistently support. If you generate enough purchase events weekly for Meta to learn effectively, optimize for purchases.
If volume is too low, optimize for add-to-cart or initiate checkout until signal density improves. The objective should match your data capacity, not your preference.
How Much Should I Budget per Day for Facebook Ads to Get Meaningful Data?
Your daily budget must support consistent conversion signals. If your expected acquisition cost requires $75 in spend to generate one purchase, running ads at $15 per day will delay learning and create unstable results. Budgeting should reflect the math behind your funnel, not your comfort level.
What Is a Good Cost per Lead on Facebook?
A good cost per lead depends entirely on downstream performance. A $10 lead becomes expensive if only 1% convert into customers. A $60 lead can be profitable if close rates are strong.
Lead cost only makes sense when evaluated against revenue per customer and sales conversion rate.
Why Do I Get Cheap Leads but No Sales?
Cheap leads often reflect low intent. When campaigns optimize for volume without qualification filters, the system prioritizes users most likely to complete the form, not necessarily those most likely to buy. Strengthening offer positioning and adding qualification steps usually improves sales quality more than lowering the cost per lead.
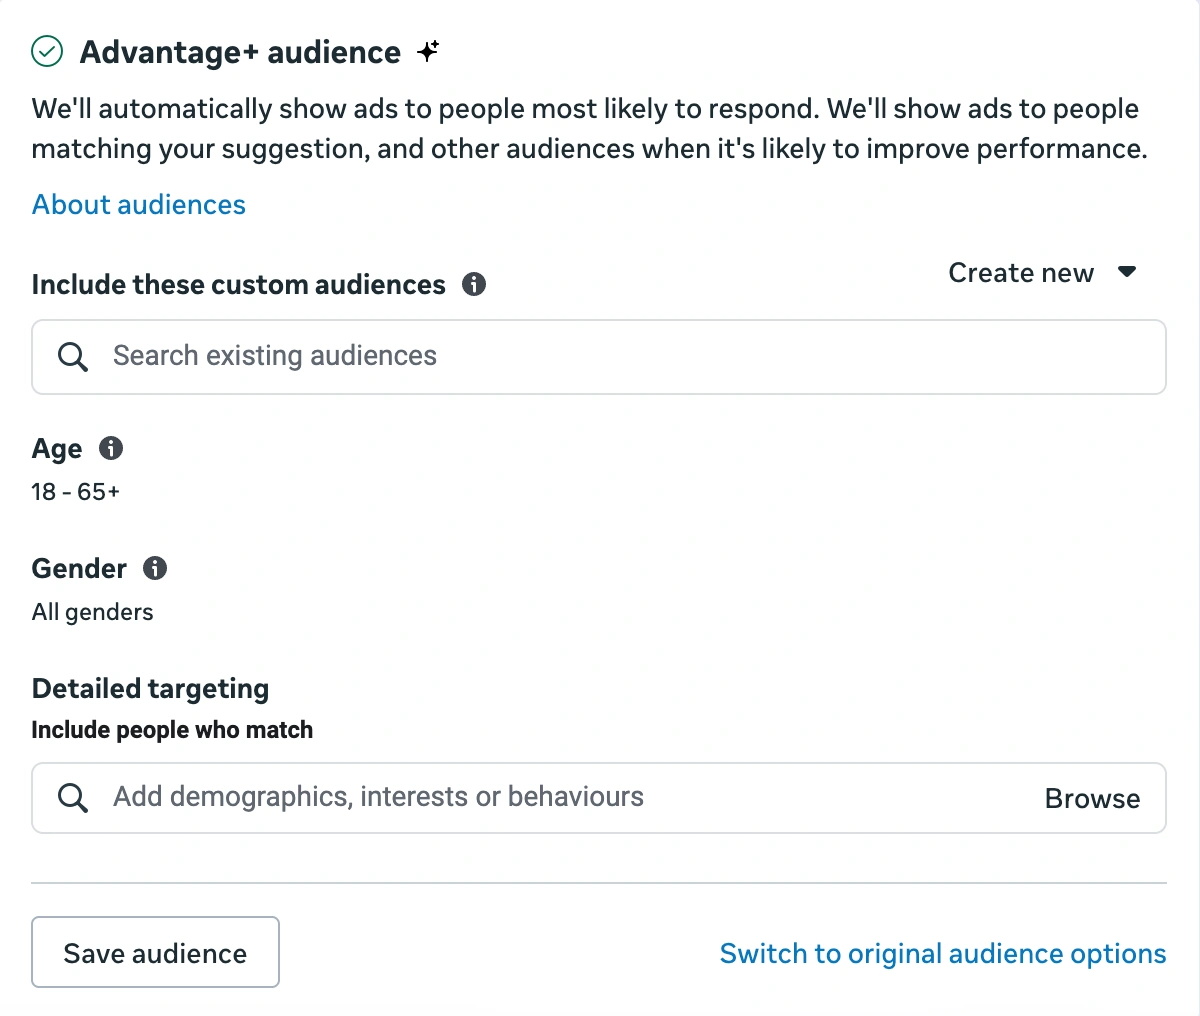
Are Advantage+ Campaigns Cheaper or Just Less Controllable?
Advantage+ can improve efficiency when strong, creative, and clear signals exist, but it reduces manual control. Automated campaigns rely heavily on algorithmic exploration. They work best when fundamentals are stable. They do not correct weak messaging or poor tracking.
How Often Should I Refresh Creatives to Keep Costs Stable?
Creative should be refreshed when engagement declines, not on a fixed schedule. If the click-through rate drops while frequency rises, fatigue is likely influencing performance. High-spend accounts require more frequent refresh cycles than smaller budgets because exposure accumulates faster.
Do iOS Privacy Changes Still Affect Facebook Ad Costs?
Privacy changes continue to influence signal accuracy and attribution clarity. Accounts with server-side tracking and clean event configuration experience more stable optimization than accounts relying solely on browser-based data. The impact today depends more on setup quality than platform mechanics.
Should I Run Facebook Ads and Instagram Ads Separately or Together?
Running placements together allows Meta to allocate budget efficiently across inventory. Separating them provides clearer diagnostic comparisons but may reduce delivery flexibility. The decision depends on whether you prioritize testing clarity or cost efficiency.
What Tracking Setup Do I Need Before I Spend Serious Money?
At minimum, you need properly configured Meta Pixel events, verified domain ownership, and prioritized conversion events. Server-side tracking through Conversions API strengthens signal reliability. Spending aggressively without reliable tracking increases volatility and misguides optimization decisions.
Is Retargeting Still Effective, or Has It Become Saturated?
Retargeting remains effective when supported by steady prospecting traffic. Small audience pools increase frequency quickly and can inflate CPM. Retargeting works best as reinforcement within a balanced funnel, not as the sole acquisition strategy.
How Do I Calculate My Break-Even CPA Correctly?
Break-even CPA equals the maximum you can spend to acquire a customer without losing margin. Subtract product cost, fulfillment, and operational expenses from average revenue per customer.
The remaining margin defines your allowable acquisition cost. Any campaign exceeding that threshold requires higher lifetime value or improved efficiency.


